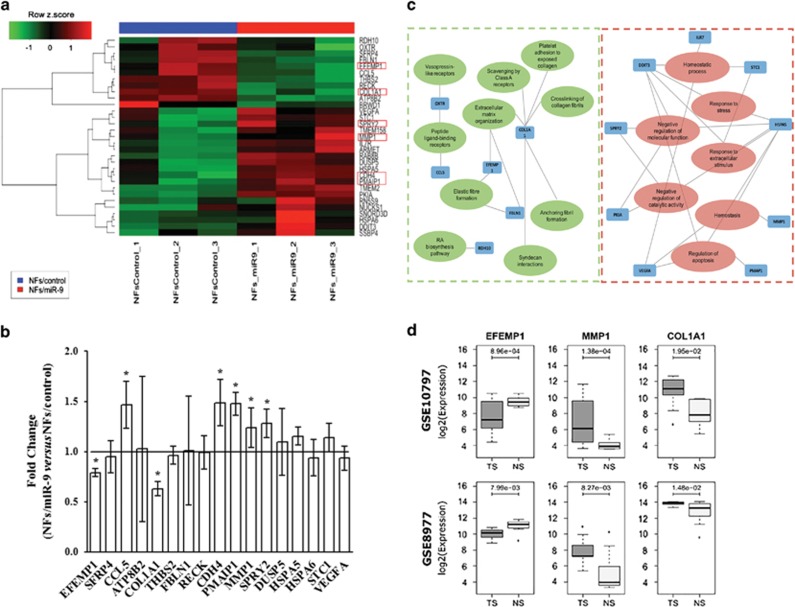
Figure 5.
Differentially expressed genes in NFs overexpressing miR-9. (a) Hierarchical clustering analysis of miR-9 exogenous expressing in NFs. Heatmap: rows correspond to differentially expressed genes and columns to samples. Red represents elevated and green downmodulated expression. (b) Validation through qRT-PCR analysis of the differentially expressed genes related with cell motility and ECM organization. The relative expression levels are shown as fold change of NFs/miR-9 versus NFs/control. (c) Interaction network of the significantly enriched gene ontologies and pathways of the differentially expressed genes in the miR-9 transient transfection model. Green and red edges represent the down- or upmodulated pathways, respectively, according to the expression of the connected genes (blue node). (d) Boxplots showing the expression levels of the three selected genes in two public gene expression data sets of tumor (TS) and normal stroma (NS) from human breast specimens. P-values from two-tailed Student's t-test are reported

