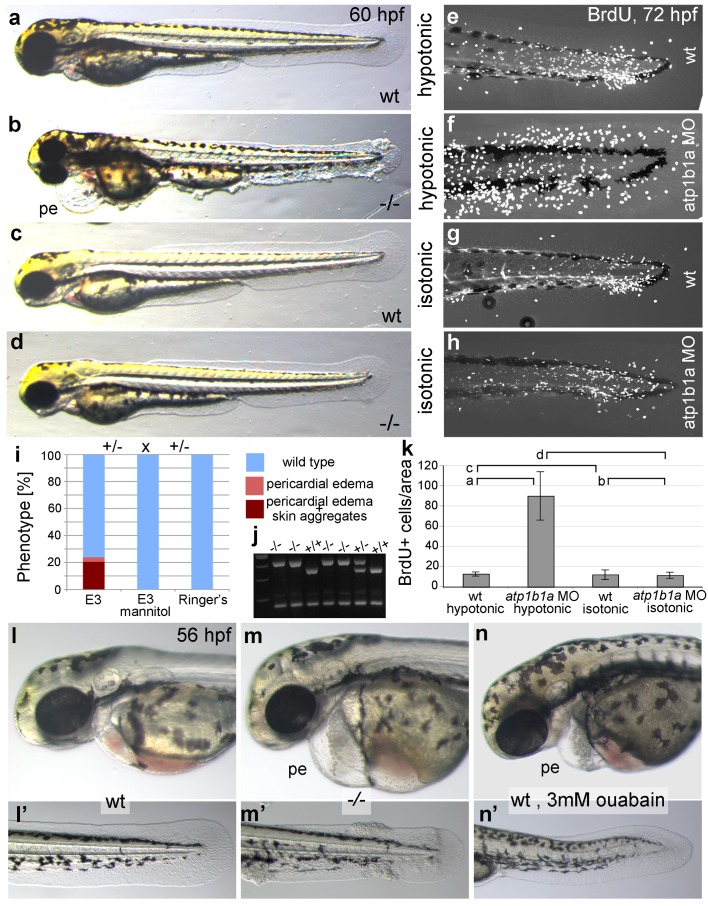
Figure 5. Epidermal hyperplasia is dependent on hypotonic conditions.
(a–k) psoriasis mutants raised in isotonic conditions do not develop epidermal hyperplasia. Live images of 60 hpf embryos (a–d) show epidermal aggregates and pericardial edema (pe) in the mutant raised in hypotonic E3 (b) but not in the mutant raised in isotonic E3 (d). IF of BrdU incorporation (white) in 72 hpf wt or atp1b1a morphant tail fins (e–h) reveals excessive cell proliferation in the fin fold of the morphant embryo (f) raised in hypotonic E3 but not in the morphant embryo (h) raised in isotonic E3. (i) Quantification of embryos as shown in (a–d), obtained from incross of two psoriasis /- parents. n = 86–122. (j) Representative gel with PCR products subjected to MwoI restriction digest to genotype embryos raised in isotonic medium. All mutants raised in isotonic medium and shown as representative examples in this and the following figures had been positively genotyped. (k) Quantification of embryos as shown in (e–h), scored is the number of BrdU-positive cells in a given area of the median fin fold. n = 3–7 per condition. Error bars represent standard deviation. p values are as follows: a: 0.0416, b: 0.9139, c: 0.8956, d: 0.0017. (l–n) Live images of 56 hpf wt embryos (l,l’), psoriasis mutant embryos (m,m’), and wt embryos treated with 3mM ouabain (n,n’) starting from 33 hpf. Blockage of Na,K-ATPase pump function by ouabain results in pericardial edema (pe) as in psoriasis mutants (n = 122/125; compare n to m), but not in epidermal aggregates (n = 0/125; compare n’ to m’).
DOI: http://dx.doi.org/10.7554/eLife.14277.015
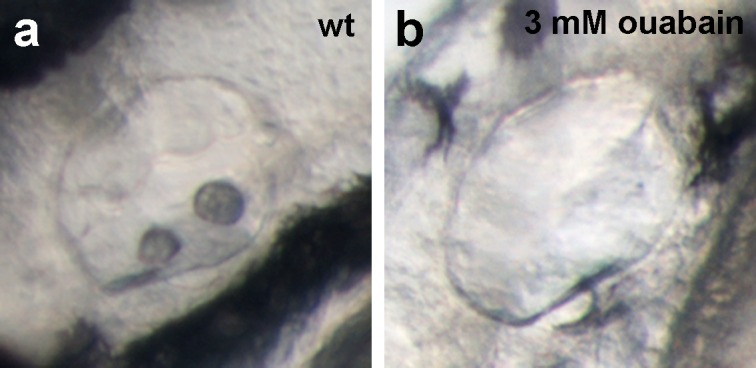
Figure 5—figure supplement 1. Live images of the otic vesicles of 48 hpf embryos show two otoliths in a untreated wt embryo (a) whereas in an embryo treated with 3 mM ouabain starting from 10 hpf, otoliths have failed to form (b; n = 76/99) or are much smaller (not shown; n = 23/99).


