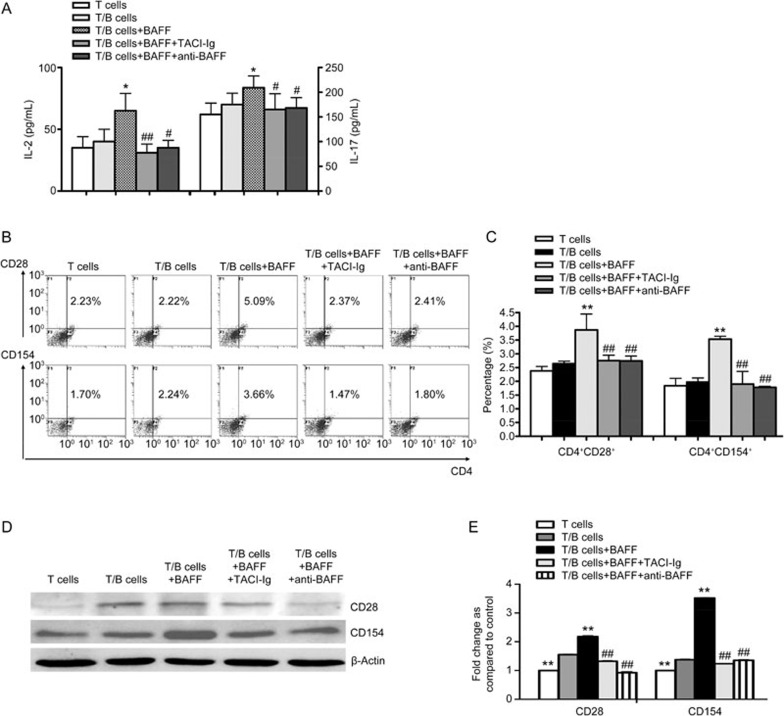
Figure 2.
B lymphocytes activated by BAFF promote T lymphocyte function. (A) ELISA of IL-2 and IL-17 levels. (B) Flow cytometry analysis of the proportions of CD4+CD154+ and CD4+CD28+ T lymphocytes. (C) Comparison of the proportions of CD4+CD154+ and CD4+CD28+ T lymphocytes in different treatment groups. (D) Western blot of the protein expression of CD154 and CD28. (E) Comparison of the protein expression of CD154 and CD28 in different treatment groups. Data are shown as the mean±SD of four samples pooled from three independent experiments, each performed in technical triplicates. *P<0.05, **P<0.01 vs T/B cells. #P<0.05, ##P<0.01 vs T/B cells+BAFF.

