
Figure 4.
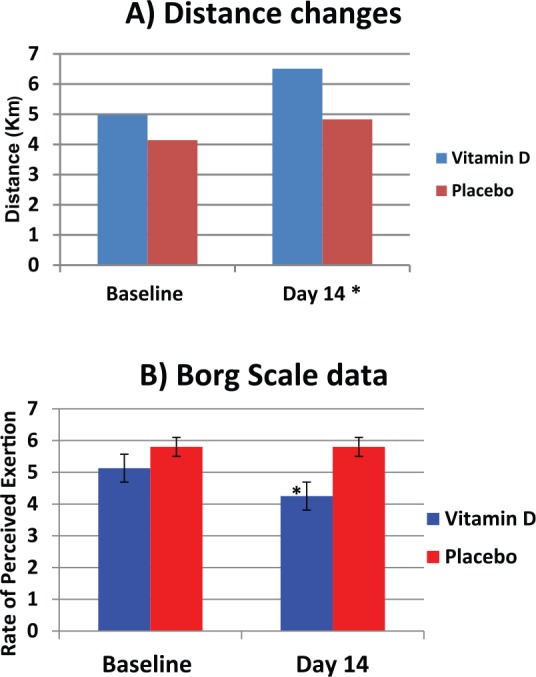
Effects of vitamin D supplementation on exercise performance measured as (A) distance, and (B) Borg Scale rate of perceived exertion
Results are expressed as mean ± SEM; (A): Participants distance cycled at baseline and day 14 of intervention, *p = 0.02; 95% CI [(-2.74) to (-0.320)]; (B): Participants rate of exhaustion after exercise calculated using Borg Scale, p = 0.02; 95% CI [(-2.74) to (-0.32)].
CI, confidence interval; SEM, standard error of the mean.