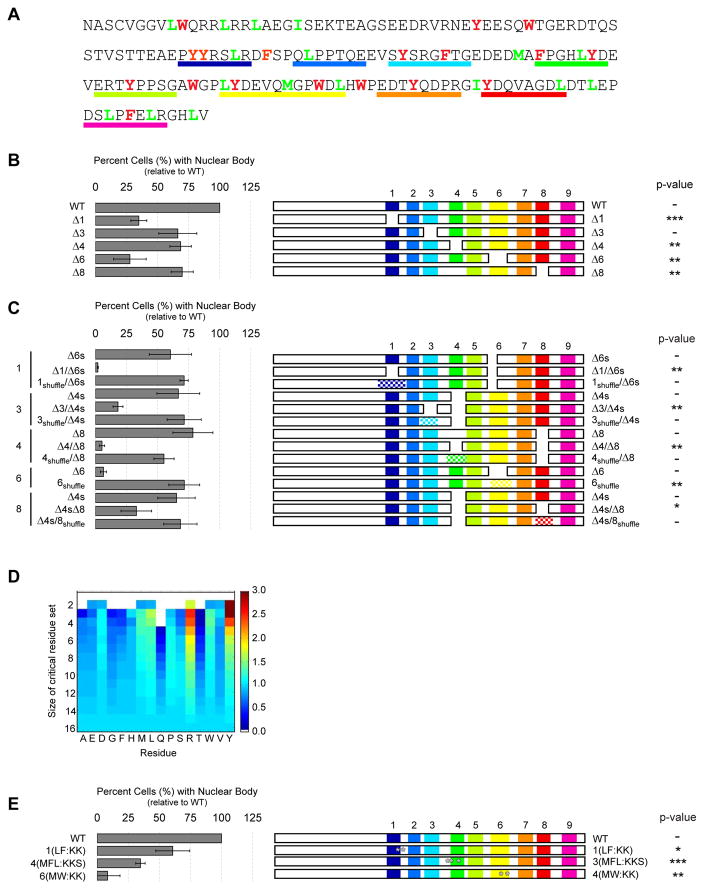
Figure 6. Identification of residue types that promote nuclear body formation.
(A) Amino acid sequence of NICD. Aromatic and hydrophobic residues are colored red and green, respectively. Regions deleted in panels B, C, and E are underlined in matching colors. (B) Normalized (to WT) percent of HeLa cells containing nuclear puncta (left) when expressing constructs deleted for individual sequence elements (schematically illustrated at right). (C) Quantification of nuclear body formation for locally shuffled sequences. The positions of shuffled sequences are checkered. (D) Heatmap of relative enrichment of specific residue types in deletions that correlated strongly with decreased cellular puncta. Warmer and cooler colors indicate enrichment and depletion, respectively, in critical residue sets. (E) Nuclear body formation by NICD point mutations. Positions of mutations are indicated by white asterisks. In panels B, C and E, data are represented as mean ± SEM and p-values for comparison to WT NICD, respective single deletion mutants and WT NICD, respectively are: * < 0.05, ** < 0.01, *** < 0.001). See also Supplemental Figure S6.

