
Fig. 2.
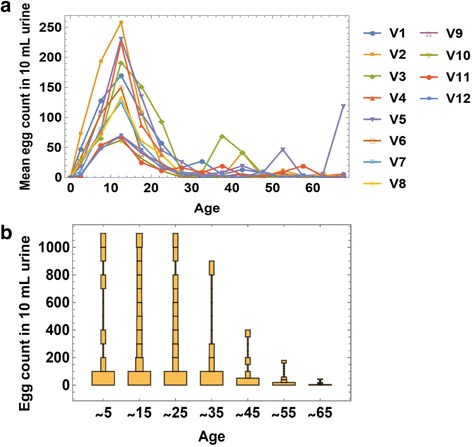
Uneven distribution of infection levels by village and by age groups. a Age distribution of mean intensity (egg count) for S. haematobium infection in 12 Kenyan villages, designated V1 to V12. b Egg-count distributions for different age groups exhibit overdispersed patterns. The orange rectangles stacked above each age range represent the relative prevalence of each infection intensity subgroup (binned by 100s of eggs per 10 ml urine) with subgroup prevalence reflected by the width of each rectangle