
Fig. 3.
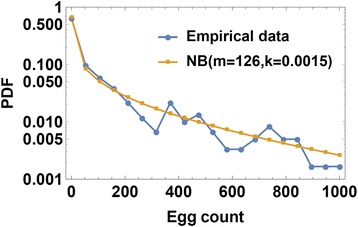
Typical community-wide egg-count distribution [24–27] fitted to a negative binomial distribution. The data from children (0–20 years of age) in the highest prevalence village, Milalani (V1), are plotted (blue line and circles) along with a fitted negative binomial (NB) curve (yellow line and circles) approximating the observed egg count distribution