
Fig. 4.
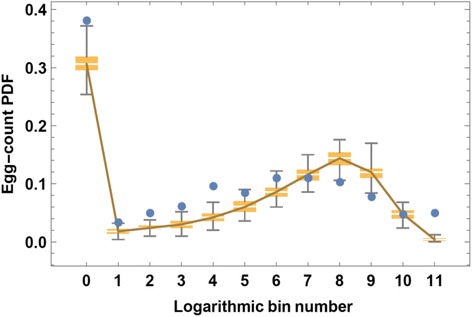
Simulated egg-test ensemble distributions vs egg-count data for a high risk village. A logarithmic bin scale (E k = 2k, k = 0, 1, …, 11) was used to plot aggregated patient data (blue dots) for comparison to results from multiple, data-generating, random SWB test simulations. Here a simulated egg-test ensemble (200 random realizations) was created based on a fixed choice of model parameters (λ = 1.8, ρ 0 = 27, w 0 = 100, r = .11). Simulation results are represented by a box and whisker plot that shows median and 25–75 % quartiles, and the 95 % range of the simulations, plotted by egg-count bin number (logarithmic scale)