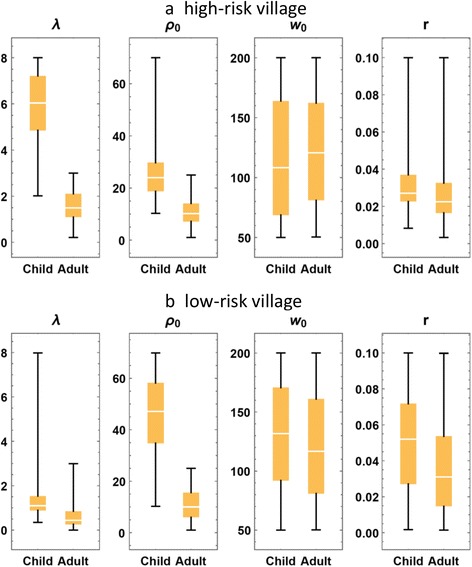
Fig. 6.

Box plot comparison of the median and range of calibrated model parameters. Summary ranges of estimated values for maximal egg release (ρ 0), crowding (w 0), and aggregation (r) parameters, presented for children and adults in high transmission villages (a upper panel) and low transmission villages (b lower panel)
