
Fig. 7.
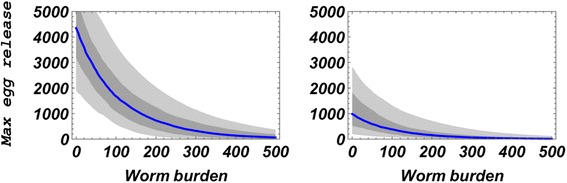
Density-dependent worm fecundity estimates [eggs/worm/day] for children (left panel) and adult (right panel) groups. Ensemble gray-scale envelopes shown here include median (blue), min/max (light grey), and 25-75 % quartile (dark grey) estimates of worm fecundity at different levels of individual human worm burden. 1,000 random parameter choices from SWB biological posterior were used to generate the estimated crowding-effect curves