
Fig. 9.
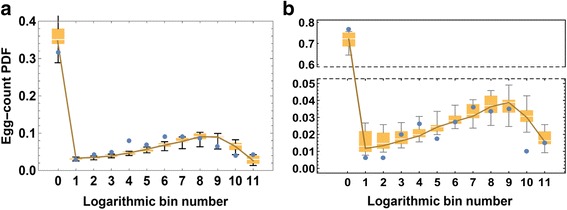
Validation of SWB model calibration for child and adult groups in a high transmission community. For each group (panel a, children; panel b, adults), we used its calibrated biological parameter ensemble and associated FOI λ estimates to generate a likely range of community realizations based on 200 different parameter choices, then simulating a likely egg-test distribution for each choice. These were then binned to indicate probable egg-count distributions. The bar-whisker chart of these binned counts is compared to the observed data (blue dots) for each group. The y-axis in panel b is truncated, having two different sections with two different scales