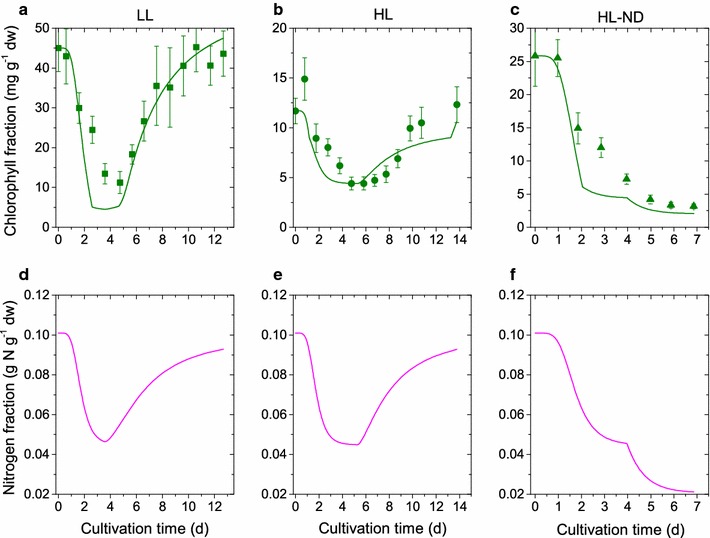
Fig. 3.

Comparison of simulation results and calibration data for chlorophyll fraction and internal nitrogen cell quota: Simulation results (lines), experimental data (symbols) and error bars under three different conditions. First row good fit model for chlorophyll fraction. Second row prediction without measurements of nitrogen quota. First column (a, d) low-light, nitrogen-replete conditions (LL). Second column (b, e) high-light, nitrogen-replete conditions (HL). Third column (c, f) high-light, nitrogen-depleted conditions (HL-ND)
