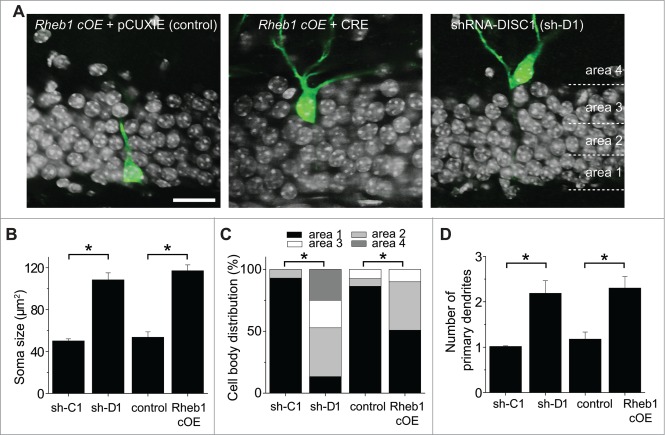
Figure 3.
Rheb1 hyper-activation recapitulates DISC1 knockdown-induced cell positioning and morphological defects of newborn neurons in the adult hippocampus. (A–C) Soma size and cell body position of newborn neurons after different manipulations at 14 dpi. Shown in (A) are sample single-section confocal images to show the soma size and localization within the defined 4 areas in the dentate gyrus. Scale bar: 20 μm. Shown in (B) is a summary of soma size. The same groups of cells as in Figure 2C were analyzed. Values represent mean + SEM. (*: p< 0.01; Student's t-test). Shown in (C) is a summary of distribution of GFP+ cells within each area as defined in (A). (D) A summary of the number of primary dendrites. The same groups of cells as in Figure 1C were analyzed. Values represent mean + SEM. (*: p < 0.01; Student's t-test).

