Figure 2.
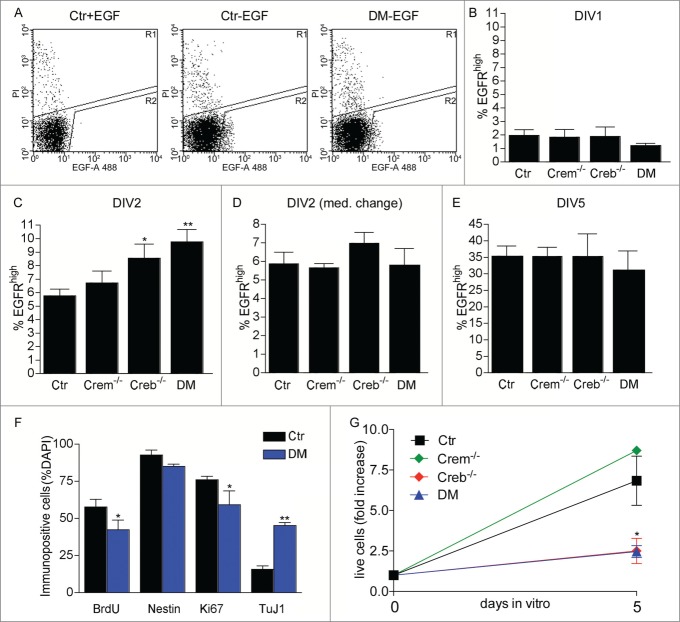
Effect of CREB and CREM on number and cycling rate of EGFRhigh precursors. (A) Representative FACS plots illustrating EGFRhigh cells in DIV1 control (Ctr) and DM cultures, pre-treated with EGF before staining with EGF-Alexa488, as negative control, or left untreated as indicated. (B–E) Quantitative analysis of EGFRhigh cells in the cultures established from the GE of E13.5 embryos with the indicated genotype measured after the indicated day in vitro (DIV). In (D) the culture medium was replaced 24 hours after plating. (F) Quantitative analysis of BrdU incorporation and expression of the given markers in EGFRhigh cells isolated from DIV2 cultures of Ctr and DM GE. Data represent means ± SEM in at least 3 independent experiments. Asterisks indicate significant differences vs. Ctr (Student's t-test) *P <0 .05; **P <0 .01. (G) Fold increase in cell number from DIV0 to DIV5 neurosphere cultures established from dissociated E13.5 GE cells of embryos with the indicated genotypes.

