
Table 3.
Results from generalized linear models describing expression of her5 (scaled relative to midbrain size) as i) a function of SU5402 at 10µM (fSU540210) and IWR-1 at either 20 or 30µM (fIWR120, fIWR130), or ii) a function of SU5402 at 10µM relative to IWR-1 (fIWR1). Addition of IWR-1 at 20 or 30µM does not result in significant changes to her5 expression (p > 0.05), but SU5402 does (p < 0.001). Addition of 30µM IWR-1 in the presence of SU5402 has an affect on her5 expression with low significance (p < 0.1), but overall IWR-1 does not significantly alter the response of her5 to SU5402 (p = 0.076). Fit of data to models R2 = 0.67
i) her5 expression as a function of IWR-1 and SU5402 concentration.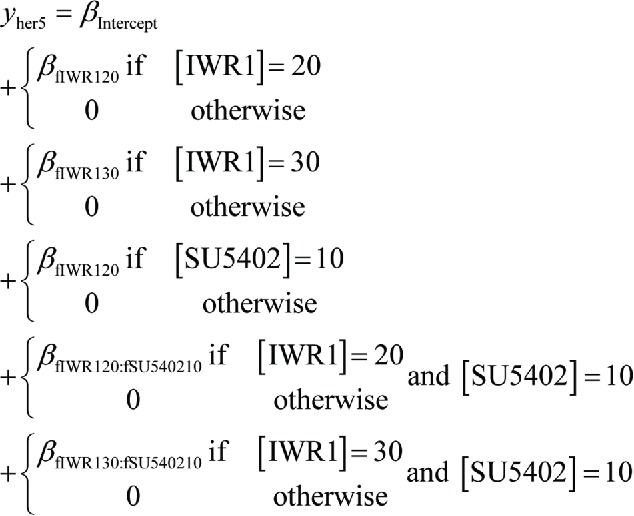
| Estimate Std. | Error | t value | Pr(>|t|) | |
|---|---|---|---|---|
| (Intercept) | 0.48836 | 0.02693 | 18.136 | < 2e-16 *** |
| fIWR120 | 0.03078 | 0.03942 | 0.781 | 0.440123 |
| fIWR130 | 0.03709 | 0.04113 | 0.902 | 0.373348 |
| fSU540210 | −0.14845 | 0.03808 | −3.898 | 0.000418 *** |
| fIWR120:fSU540210 | −0.05031 | 0.05697 | −0.883 | 0.383250 |
| fIWR130:fSU540210 | −0.10557 | 0.05817 | −1.815 | 0.078133. |
ii) her5 expression as a function of IWR-1 and SU5402 presence. 
| ||||
| |
Estimate Std. |
Error |
t value |
Pr(>|t|) |
| (Intercept) | 0.489451 | 0.025566 | 19.145 | < 2e-16*** |
| fSU540210 | −0.145272 | 0.036210 | −4.012 | 0.000282*** |
| IWR1 | 0.001297 | 0.001294 | 1.003 | 0.322598 |
| fSU540210:IWR1 | −0.003342 | 0.001833 | −1.823 | 0.076349. |