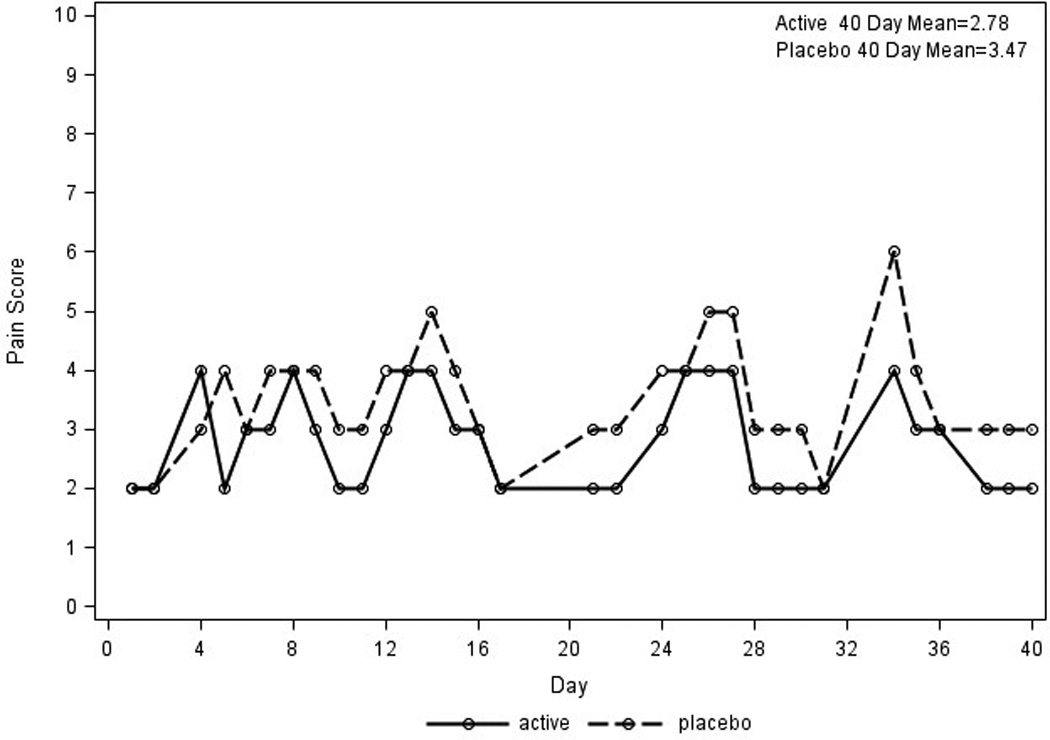
Figure 4. Pain Improvement for Patient 7.

Daily pain scores are plotted for patient 7 with pain improvement on treatment for stressed feet. X axis represents days; Y axis represents daily pain scores The solid line represents pain scores on the foot with study cream; the dotted line represents the pain score for the foot receiving placebo cream.
