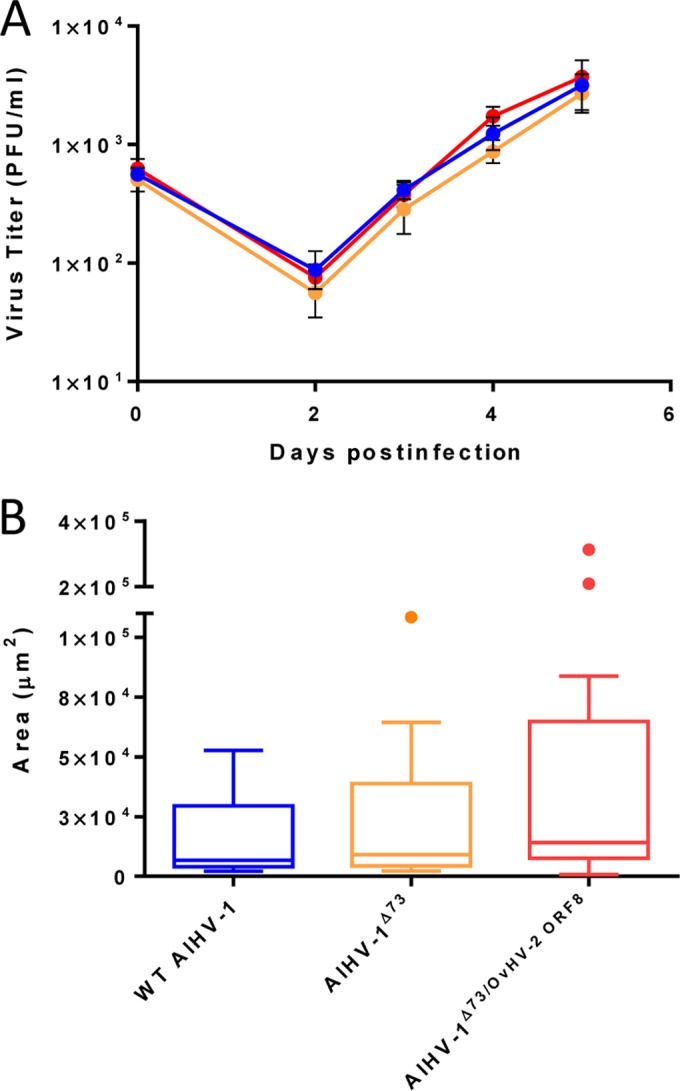
FIG 4 .

Viral replication kinetics and plaque size assay. (A) Multistep growth curves of the AlHV-1/OvHV-2 chimera (AlHV-1ΔORF73/OvHV-2-ORF8 [red line]), parental (AlHV-1ΔORF73 [orange line]), and the wild-type AlHV-1 (blue line) viruses in FMSKhTERT.1 cells. Virus titers at day zero were calculated from viral stock titrations. Data presented for days 2, 3, 4, and 5 are means ± standard deviations (SD) (error bars) of triplicate measurements. No statistically significant difference in titers among the three viruses was observed at any time postinoculation (P = 0.8270 by ANOVA). (B) Average plaque size of the chimeric, parental, and wild-type (WT) viruses measured at 3 days postinfection. Boxes indicate median plus the 25th and 75th percentiles for 14 plaques measured for each virus. Dots indicate outliers, as defined by the Tukey method. No statistically significant difference in the plaque sizes of the three viruses was observed (P = 0.1561 by ANOVA).
