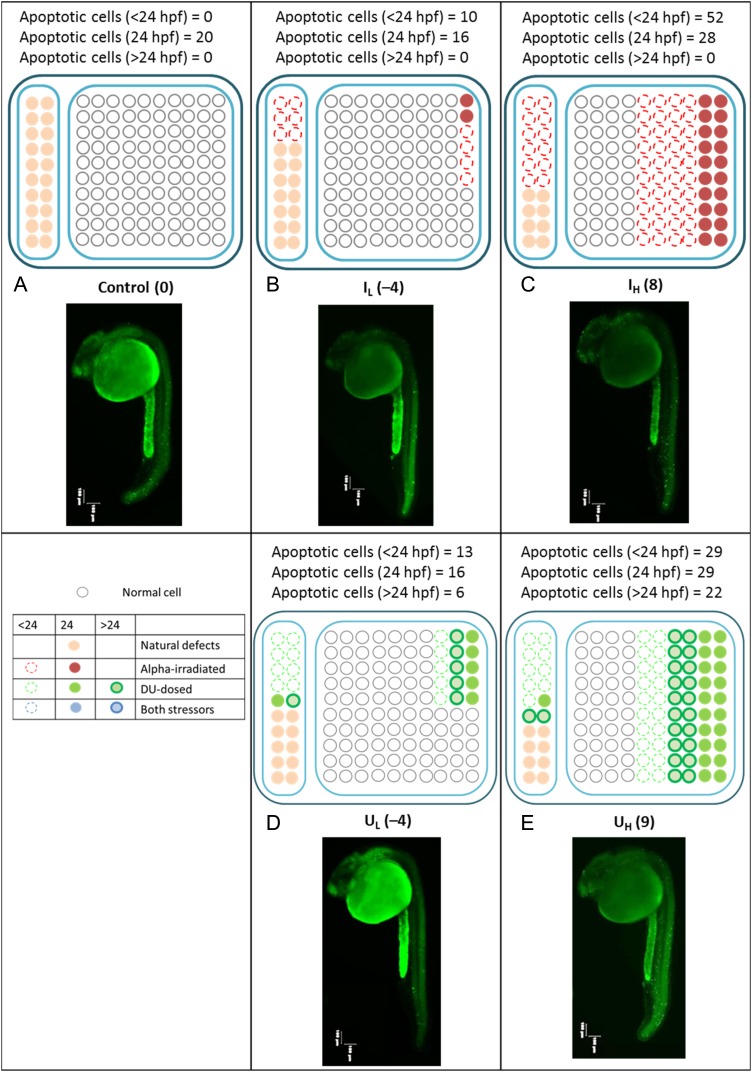
Fig. 3.
Cell deaths induced by alpha particles and depleted uranium. Simplified schematic diagrams showing the patterns of cell deaths induced by different alpha-particle doses alone and by different DU concentrations exposure alone. Numbers in brackets represent the net number of apoptotic cells at 24 hpf (i.e. after subtracting the background number). Left columns: naturally aberrant cells; right columns: healthy cells if no external stressors; red color: cells affected by alpha particles; green color: cells affected by DU; open circles with dotted outlines: cells that undergo apoptosis earlier than 24 hpf; solid circles with colors other than white: cells that undergo apoptosis at 24 hpf; open circles with bold outlines: cells that undergo apoptosis after 24 hpf; white solid circles: normal healthy cells that were not affected by any stressors or those that could repair the damages successfully; pink solid circles: naturally aberrant cells that underwent apoptosis at 24 hpf. Representative images of stained embryos in C, IL, IH, UL and UH groups were also shown. Images of embryos were captured, using a fluorescent microscope with a magnification of ×40. Three images focusing on different sections of the embryos were captured and were then combined into one image.

