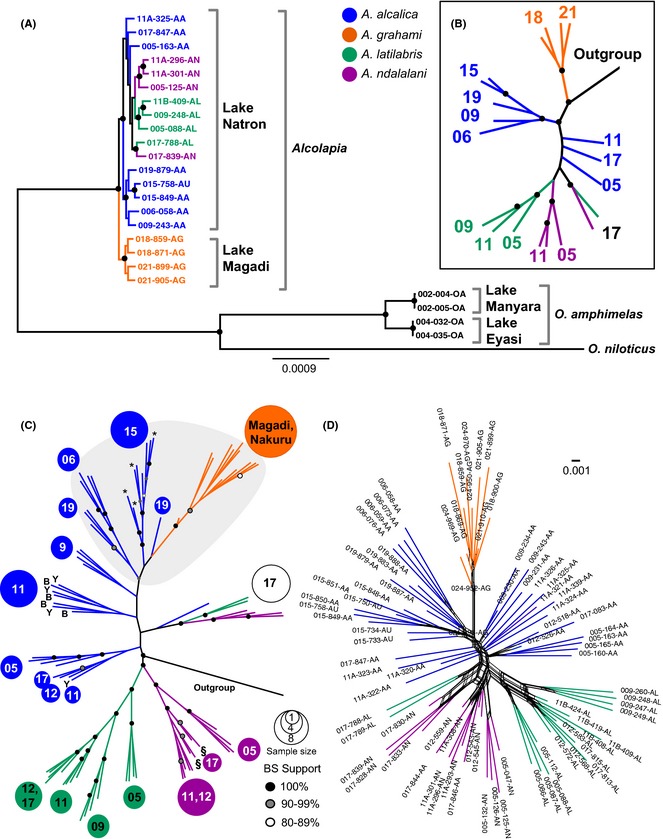
Figure 2.

Phylogenomic analysis of RAD sequences aligned to the O. niloticus reference genome. (A) Maximum‐likelihood phylogeny (RAxML) for the reduced‐taxon data set (n = 25), full quality‐filtered alignment (data set B; 26 million bp); (B) radial tree layout for tree in panel A; (C) ML phylogeny of the full taxon data set (n = 92) alignment of variable sites only (data set D; 544 916 SNPs); (D) phylogenetic network (Neighbour‐Net) of ingroup taxa (data set M; 84 samples, 246 336 SNPS). (B–C) Numbers at tips indicate the sampling location (population) of individuals in each clade; branch length to outgroup has been truncated for clarity. (C) Northern Lake Natron sites and Magadi/Nakuru sites are shaded in grey. * indicates A. alcalica upturned‐mouth morph individuals from site 15. § indicates possible hybrids that displayed intermediate morphology between A. alcalica and A. ndalalani from site 17. B and Y at tips indicate, respectively, blue or yellow A. alcalica morphs found at site 11.
