
Figure 4.
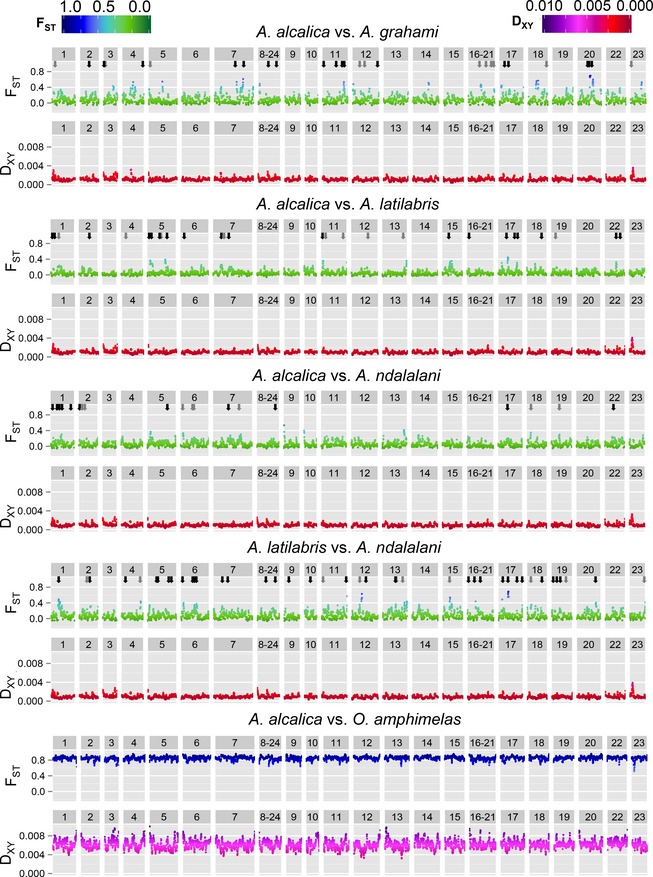
Sliding‐window analysis of relative (FST) and absolute (DXY) divergence for pairwise species comparisons. Eight samples per species were used for each comparison except for the final comparison, which was based on seven samples per species. Results are plotted by linkage group of the reference genome (O. niloticus) as indicated by numbers in the upper grey bar of each plot. Window size is 1 Mb with a slide of 100 kb. Approximate genome position of FST outliers identified by bayescan is indicated by arrows for FDR = 0.05 (black) and FDR = 0.10 (grey).