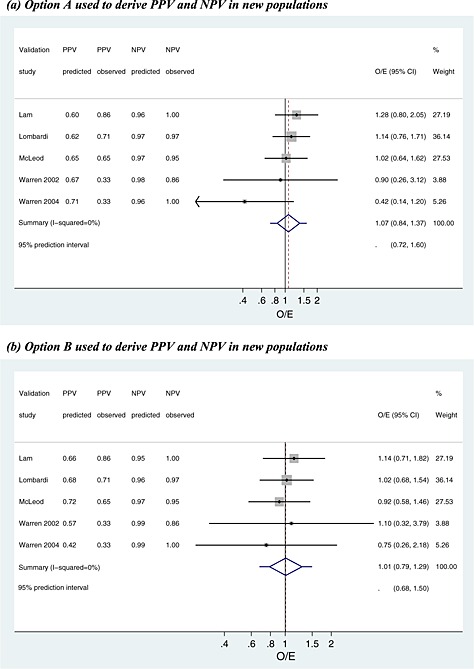
Figure 3.

Meta‐analysis of the observed/expected (O/E) calibration statistics (frequentist estimation of model (16)) from the internal–external cross‐validation approach applied to the parathyroid data at 1–2 h for prediction of hypocalcaemia. PPV, positive predictive value; NPV, negative predictive value.
