
Figure 4.
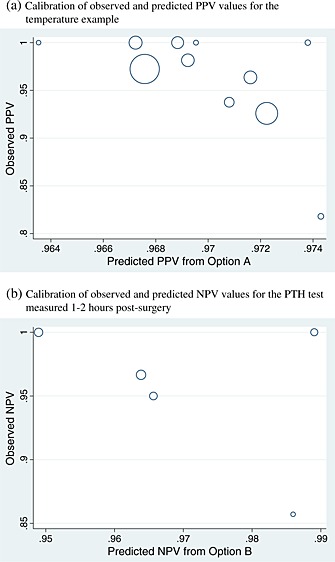
Calibration of predicted and observed post‐test probabilities, for (a) positive predictive value (PPV) derived using option A in the temperature example and (b) negative predictive value (NPV) derived using option B in the parathyroid example. Each circle represents a study and is proportional to the study sample size.