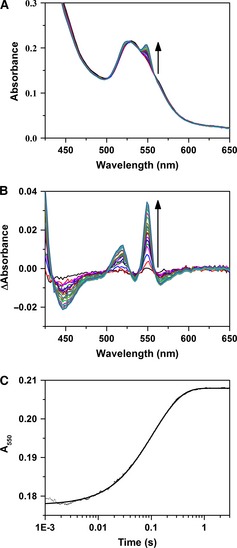
Figure 3.

Cytochrome c reduction by CPR. (A) Stopped‐flow photodiode array spectra showing cyt c reduction by 1× NADPH‐reduced CPR. (B) Absorbance difference spectra, relative to the spectrum at 5 ms, derived from the data in (A). (C) Single wavelength transient at 550 nm derived from the data in (A) fitted to a double‐exponential function. Experimental conditions were 2 μm CPR mixed with 2 μm NADPH and aged for 2 s prior to a second mix with 20 μm cyt c. All samples were in suspended in 50 mm potassium phosphate buffer (pH 7.0) at 25 °C.
