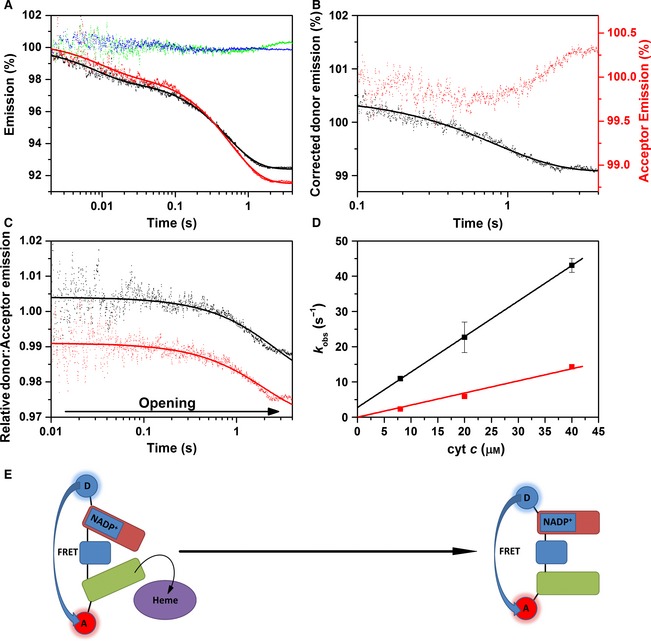
Figure 9.

Double‐mixing stopped‐flow fluorescence of 1 × NADPH‐reduced CPR versus cyt c. (A) Labelled CPR stopped‐flow fluorescence transients. Fluorescence donor transients are indicated in black for singly labelled protein (CPR‐D) and red for doubly labelled protein (CPR‐DA), whereas acceptor transients are indicated in blue for singly labelled protein (CPR‐A) and green for doubly labelled protein (CPR‐DA). (B) Acceptor and corrected donor emission. (C) CPR donor:acceptor ratio (representing domain dynamics) for both reactions with 20 μm cyt c (black) and 40 μm cyt c (red). In (C), data are vertically offset to show the individual traces. (D) UV‐Vis kinetics of 1 × NADPH‐reduced CPR‐DA with cyt c. The black and red datasets represent the first and second kinetic phases, respectively. Both datasets are fitted to linear trends with second‐order rate constants of 1.01 ± 0.01 and 0.34 ± 0.02 μm −1·s−1 for the first‐ and second‐order rate constants, respectively. (E) Schematic of domain dynamics showing the predominant conformational sub‐state during the oxidative half‐reaction of CPR. The FAD/NADP +‐binding domain, the FMN‐binding domain and the connecting domain are represented by red, green and blue rounded rectangles, respectively. The redox partner protein cytochrome c is shown as a purple oval. Experimental conditions were 50 mm potassium phosphate buffer (pH 7.0), 1 μm labelled CPR (4 μm labelled CPR for UV‐Vis measurements), at 25 °C. Donor and acceptor fluorophores were excited at 650 and 750 nm, respectively, and fluorescence data were smoothed using a five‐point moving average.
