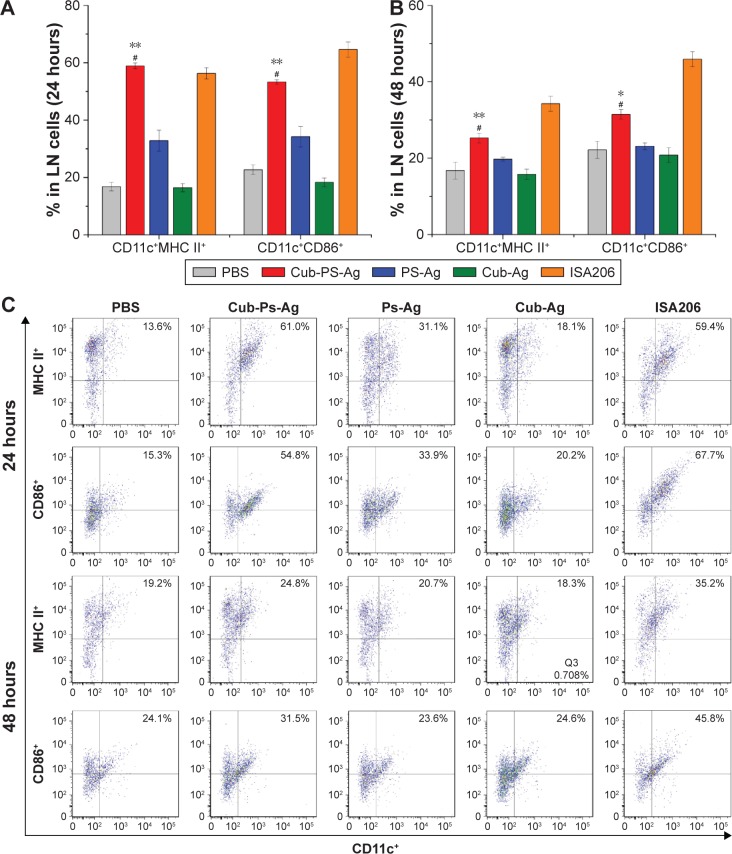
Figure 6.
Cub-PS activating DCs in the draining lymph nodes in vivo.
Notes: Percentage of CD11c+MHC II+ and CD11c+CD86+cells in a total of 20,000 lymphocytes from naive mice or mice vaccinated with PS-Ag, Cub-Ag, Cub-PS-Ag, and ISA206 at (A) 24 hours and (B) 48 hours after subcutaneous injection. FACS plots in (C) are representative of the mean percentages of three mice in each group. Data are expressed as the mean ± SEM. *P<0.05 and **P<0.01 vs the PS-Ag group, while #P<0.05 vs Cub-Ag group.
Abbreviations: Ag, antigen; CD, cluster of differentiation; Cub-Ag, mixture of cubosomes and Ag; Cub-PS-Ag, mixture of cubosome-polysaccharide nanoparticles and Ag; DC, dendritic cells; FACS, fluorescence-activated cell sorting; LN, lymph node; MHC, major histocompatibility complex; PBS, phosphate-buffered saline; PS-Ag, mixture of PS and Ag; SEM, standard error of the mean.

