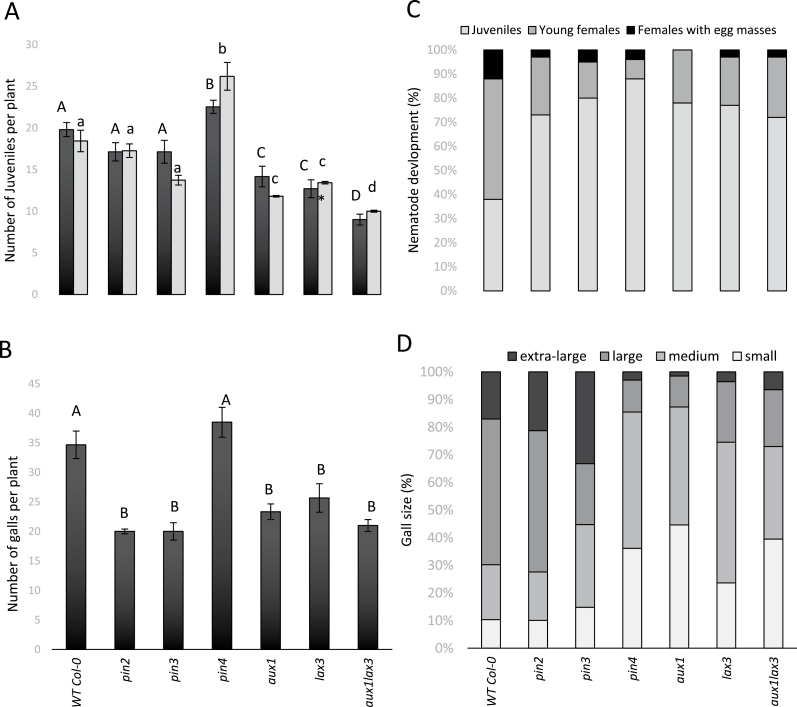
Fig. 5.
Analyses of aux1, lax3, aux1 lax3, pin2, pin3, and pin4 Arabidopsis mutants infected by the RKN M. incognita. (A) Number of J2 per plant, counted at 3 and 7 DAI. Different letters indicate statistically significant differences based on ANOVA and Tukey’s test (P < 0.05), using upper case for 3 DAI and lower case for 7 DAI. (B) Number of galls at 35 DAI. Different letters indicate statistically significant differences (P < 0.05). (C) Developmental stages of the observed nematodes within the galls 42 DAI, shown as percentages. (D) Classification of gall sizes at 35 DAI, shown as percentages. Extra-large (> 2.5mm), large galls (1.5–2.5mm), medium galls (1–1.5mm), and small galls (<1mm). In A and B, bars represent the average ± standard deviation of at least 10 individual plants. The whole infection experiment was twice independently repeated, giving similar results. In C and D, bars represent the percentage of each developmental stage (of ~400 nematodes per line) or gall size (of ~250 galls per line) counted on all 10 individual plants in one infection experiment.

