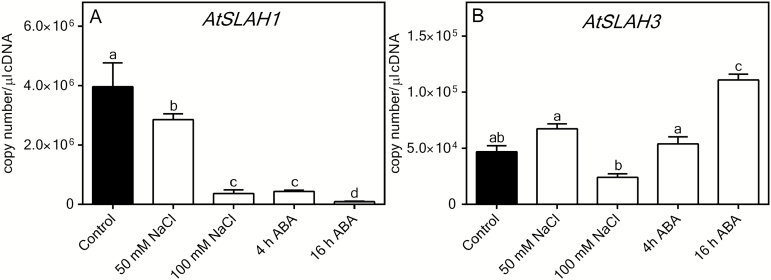
Fig. 1.
Expression level of AtSLAH1 (A) and AtSLAH3 (B) treated with control (2mM NaCl), 50mM and 100mM NaCl for 7 days, or 20 μM ± cis-trans-ABA for 4 or 16h. Arabidopsis (Col-0) were grown in hydroponics for 5 weeks and exposed to NaCl treatment for 7 days. The ABA was applied 4 or 16h before harvest. Transcripts were detected in the whole root cDNA. Results are presented as means+SEM, n=5. The expression levels were normalized to four control genes (AtGAPDH, AtActin2, AtTubulin and AtCyclophilin). Statistical significance was determined by one-way analysis of variance (ANOVA) and Tukey’s test (P≤0.05); a, b and c represent data groups that are statistically different from each other.

