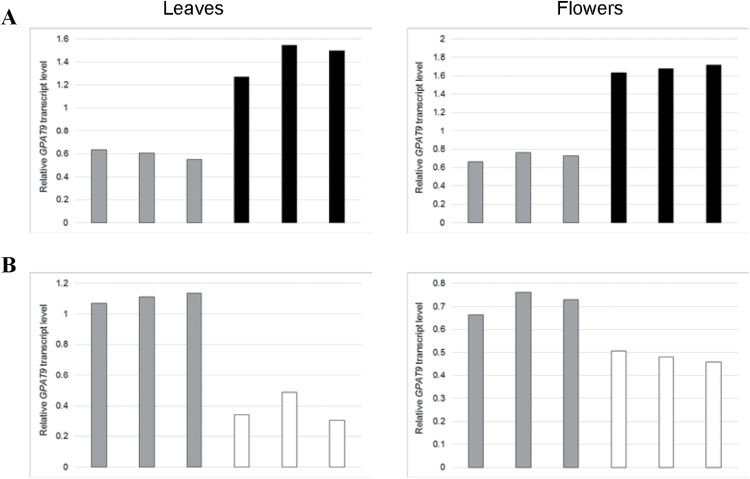
Fig. 3.
Confirmation of alterations in constitutive GPAT9 expression in leaves and flowers of GPAT9-OE and GPAT9-RNAi lines compared to wild type. Quantitative real-time RT-PCR analysis of GPAT9 expression in independent T1 GPAT9-OE (A), GPAT9-RNAi (B) and wild-type lines. Blocks denote mean GPAT9 transcript levels from three technical replicates relative to the internal control, PP2AA3. Gray blocks represent wild-type plants, black blocks represent independent GPAT9-OE lines, and white blocks represent independent GPAT9-RNAi lines.

