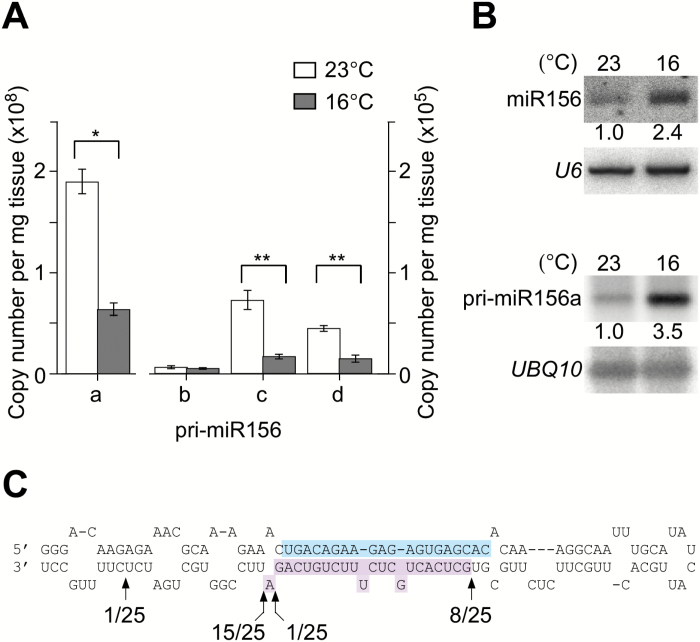
Fig. 1.
Levels of different primary transcripts of miR156 (pri-miR156) and mature miR156 at different temperatures. (A) Absolute quantification of pri-miR156a, b, c, and d transcripts in 8-day-old wild-type plants grown at 23 °C and 16 °C (*, P<0.01; **, P<0.001). (B) Levels of mature miR156 determined by northern blot analysis (upper panel) and levels of cleaved products of pri-miR156a determined by 5′-RLM-RACE (lower panel) in 8-day-old wild-type plants grown at 23 °C and 16 °C. The relative band intensities of mature miR156 and cleaved pri-miR156a are shown. U6 and UBQ10 were used as loading controls in each experiment. (C) Map of cleavage sites of pri-miR156a. The mature miR156a and miR156* sequences are shown in cyan and purple, respectively. The arrows indicate the end of amplicons with the fraction of sequenced clones corresponding to each site. The numbers below the arrows indicate the number of sequenced clones corresponding to each site.

