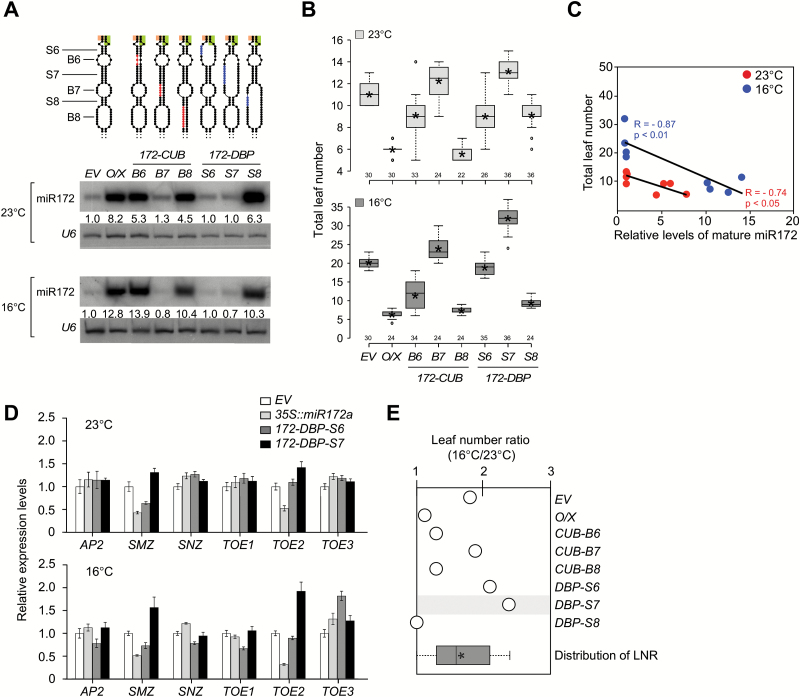
Fig. 4.
Analysis of structural variants in the lower stem of pri-miR172a. (A) Levels of mature miR172 in plants overexpressing mutations grown at 23 °C and 16 °C. U6 was used as a loading control. Introduced mutations are indicated in colors in the secondary structures of pri-miR156a above the gel blots. The numbers below each band indicate the fold-change relative to the miR172 level in EV plants after normalization to U6 at each temperature. (B) Flowering time of homozygous plants carrying each structural variant in the pri-miR172a upper stem at 23 °C and 16 °C. Distribution of leaf numbers is shown as a box plot (see methods for further information for box plots). (C) Correlation between mature miR172 levels (Fig. 4A) and flowering time (Fig. 4B) in plants carrying structural variants in the pri-miR172a lower stem at 23 °C and 16 °C. R, Pearson correlation coefficient. (D) Expression levels of miR172 target genes in 9-day-old seedlings of 172-DBP-S6 and 172-DBP-S7 plants at 23 °C and 16 °C, determined via qPCR. Error bars indicate standard deviation. Expression levels of each gene in EV plants were set to 1. AP2, APETALA2; SMZ, SCHLAFMÜTZE; SNZ, SCHNARCHZAPFEN, ; TOE1, 2, 3, TARGET OF EAT1, 2, 3 (E) Leaf number ratio (16 °C/23 °C) of plants overexpressing structural variants of pri-miR172a. Distribution of LNR of the plants presented in this graph is shown as a box plot at the bottom of graph. Note that 172-DBP-S7 plants showed slightly increased sensitivity to ambient temperature changes. O/X, plants overexpressing the un-mutated constuct (35S∷miR172a).

