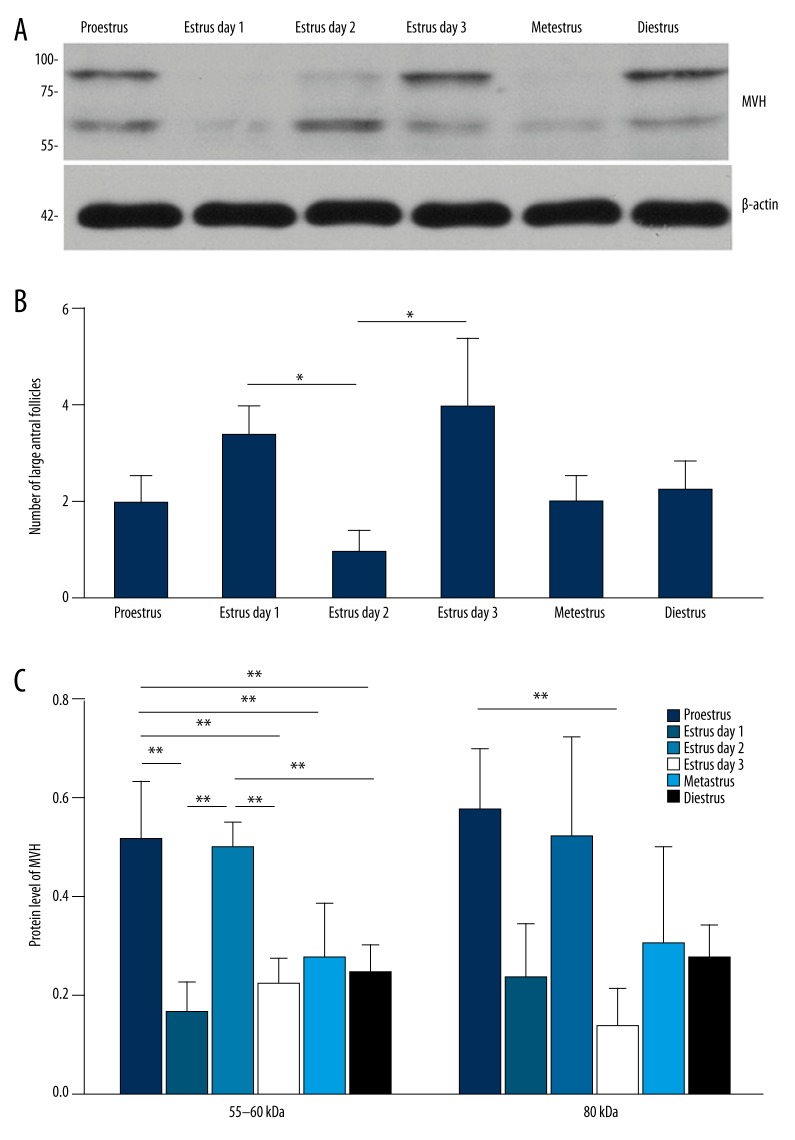
Figure 2.
Expression pattern of MVH protein in different stages of estrous cycle. (A) Western blot for MVH in the bone marrow in different stages of estrous cycle. N=4 each. (B) Western blot for MVH in the ovary in different stages of estrous cycle. N=6 each. The numbers on the left in (A, B) are the size standards of molecular weight (in kDa). The expression level of MVH in (A-B) was normalized to that of β-actin. (C) Analysis of follicular counts of large antral follicles. Data in (A–C) are shown in mean values ±SEM. The statistical significance is shown as * P<0.05; ** P<0.01.

