Figure 1.

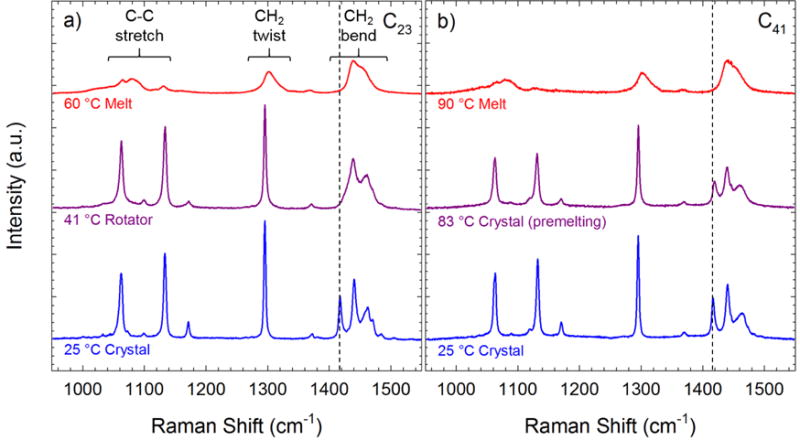
Raman spectra of a) the C23 alkane and b) the C41 alkane at three different temperatures. The spectra are scaled by the integrated intensity of the CH2 twist region. The dashed line indicates the crystalline peak.

Raman spectra of a) the C23 alkane and b) the C41 alkane at three different temperatures. The spectra are scaled by the integrated intensity of the CH2 twist region. The dashed line indicates the crystalline peak.