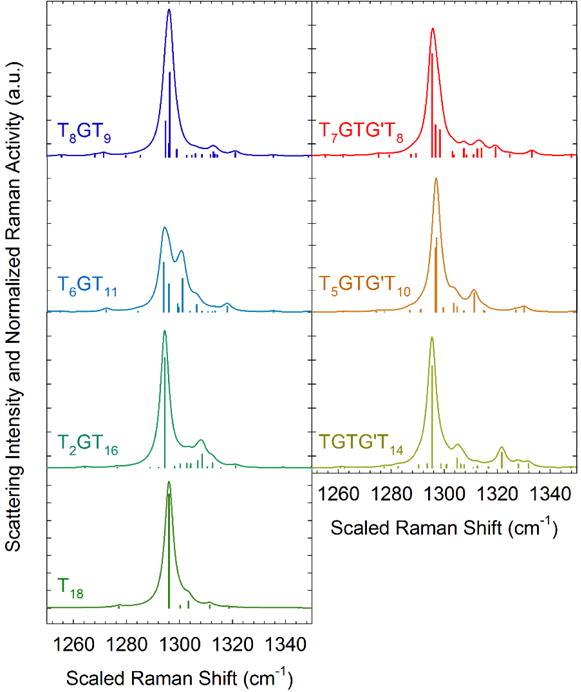
Figure 7.

Calculated Raman scattering intensity (smooth lines) and Raman activity (vertical bars) of a C21 alkane in the CH2 twist region with either gauche bonds or GTG′ sequences. For each plot, the scattering intensity is normalized by the area under the curve in the CH2 twist region. The Raman activity is normalized by the maximum Raman activity value and scaled to fit under the scattering intensity curve for clarity.
