Figure 2.

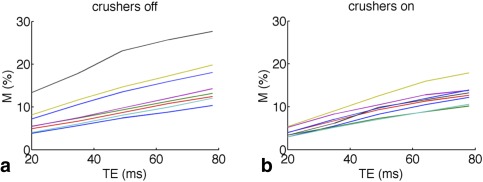
M as a function of echo time (TE), as typically measured in a calibrated fMRI experiment (a) and with intravascular crushers applied (b). Each line represents a different subject.

M as a function of echo time (TE), as typically measured in a calibrated fMRI experiment (a) and with intravascular crushers applied (b). Each line represents a different subject.