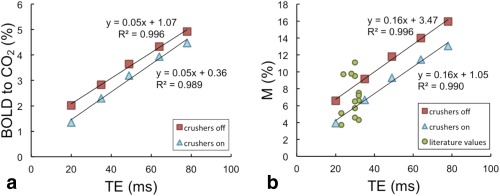
Figure 3.

Mean BOLD response to hypercapnia (a) and mean M (b) from this study, with crushers turned on (blue triangles) and off (red squares). The results of linear fits have been added. Green circles show M results from past studies over a range of BOLD echo times (TE).
