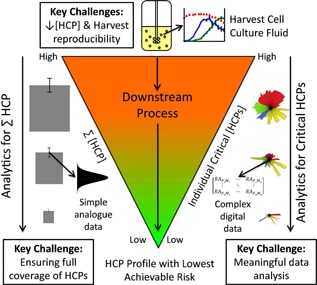
Figure 1.

Overview of the HCP landscape in the context of biologics manufacture. The left side of the figure shows a typical ELISA‐based approach where a summed value of the HCPs detected by the polyclonal antibody used is generated with a probability of error (usually based on a Gaussian distribution as indicated). On the right side, a mass spectrometry driven approach is depicted indicating the far larger datasets of multiple species in a first mass spectra which themselves be further fragmented to create spectra for identification. The differing challenges for these differing approaches are highlighted.
