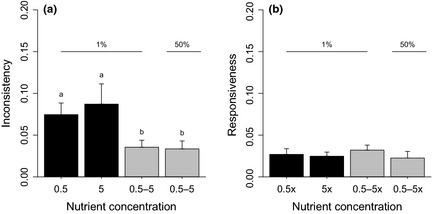
Figure 4.

Mean (± SE) inconsistency (a) and responsiveness (b) in host–parasite populations coevolving in homogenous (black bars) and heterogeneous (grey bars) structured populations linked by dispersal. Letters denote significant differences (P < 0.01).
