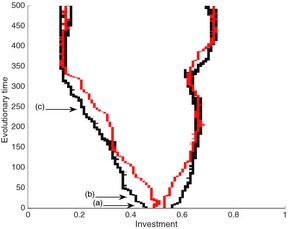
Figure 5.

Example coevolutionary trajectory of hosts (black) and specialist parasites (red). The points marked (a–c) correspond to the values of h used in the plots in Fig. 6. Parameter values: b = 2, q = 0.1, d = 1, α = 1, β S = 1, ω = 0.1. The output was generated by numerically solving the population dynamics (A.2)–(A.5) for a ‘resident’ strain using a Runge‐Kutta routine in the C programming language. These dynamics are run for large time such that it is approaching its dynamic attractor before an additional mutant strain is introduced at low density, and the dynamics are run again. At the end of each run, if any strain has fallen below a low threshold, it is assumed to be extinct.
