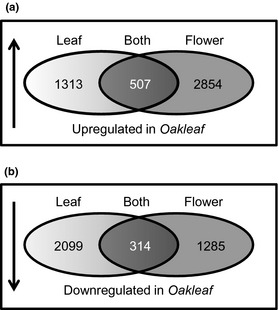
Figure 8.

Identification of up‐ and downregulated genes in Primula vulgaris Oakleaf compared with wild‐type. Venn diagrams showing: (a) numbers of genes upregulated in Oakleaf leaves (light grey) and Oakleaf flowers (mid‐grey) compared with pin wild‐type leaves and flowers. The numbers of genes upregulated in both organs (dark grey) are shown. (b) Numbers of genes downregulated in Oakleaf leaves (light grey) and Oakleaf flowers (mid grey) compared with pin wild‐type leaves and flowers. The numbers of genes downregulated in both organs (dark grey) are shown.
