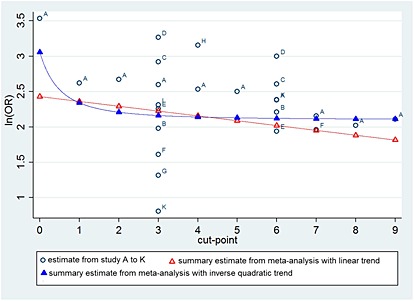
Figure 2.

Comparison of the individual study estimates and the summary meta‐analysis results obtained from model (5), assuming either a linear trend or an inverse quadratic trend, for the prognostic effect of the Apgar score at each cut‐point, in relation to neonatal mortality. Confidence intervals around each point are not shown for cosmetic reasons, but are provided for the summary estimates in Table 3. Odds ratios are defined as the odds of death for those with an Apgar score cut‐point value, divided by the odds of death for those with an Apgar score > cut‐point value.
