
Figure 4.
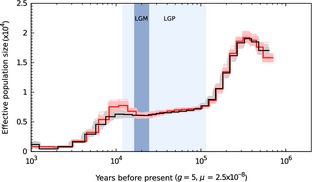
Historical effective population size of the African dromedary inferred with the filtered, repeat‐masked set of variants (black line; strict conditions) and with default parameters (red line; lenient conditions) in psmc (Li & Durbin 2011). The lighter‐coloured lines of the same colour represent the 100 bootstrap replicates. The result is scaled using a generation time (g) of five years and a per‐base mutation rate (μ) of 2.5 × 10⁻⁸. The light‐blue and blue‐shaded regions indicate the last glacial period (LGP) and last glacial maximum (LGM), respectively.