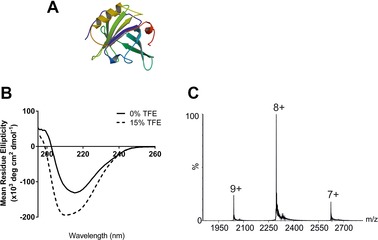
Figure 1.

(A) Ribbon diagram of bovine β‐lactoglobulin (PDB: 3BLG 38); (B) β‐lactoglobulin CD spectra in 50 mM ammonium acetate in the absence of TFE (black line) and with 15% TFE added (dashed line); (C) ESI‐MS spectrum of bovine β‐lactoglobulin in 50 mM aqueous ammonium acetate.
