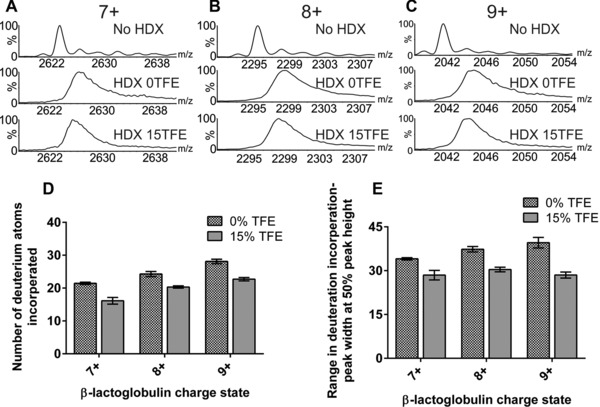
Figure 2.

ESI‐MS gas‐phase HDX of β‐lactoglobulin. ESI‐MS spectra showing the degree of deuterium incorporation experienced by β‐lactoglobulin in the absence of TFE (0TFE) and with 15% TFE (15TFE) added for (A) the 7+ ions; (B) the 8+ ions and (C) the 9+ ions. (D) The mean deuterium incorporation of the 7+, 8+ and 9+ ions in the absence of TFE and with 15% TFE added; (E) the range of deuterium incorporation into the 7+, 8+ and 9+ ions estimated by identifying the peak width at 50% peak height. All bar charts represent the mean values of three replicates; error bars are the standard deviation of the mean.
