
Figure 1.
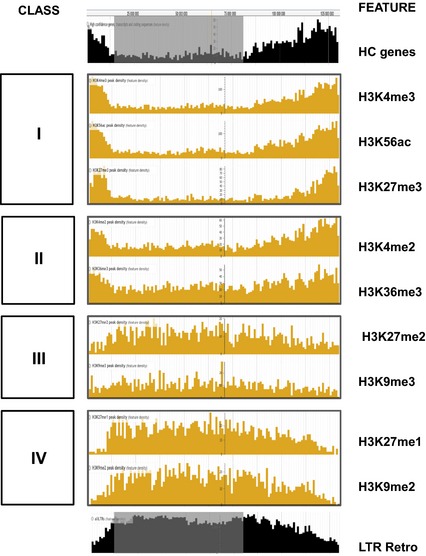
Densities of assigned peaks for histone modifications across barley chromosome 1H.
Local peak densities (peaks per 1‐Mbp bin) for the nine histone modifications studied here are plotted against pseudophysical position on barley chromosome 1H in JB rowse (see Experimental Procedures). Distribution Classes I–IV are described in the text. The corresponding densities of high‐confidence (HC) genes and long terminal repeat retrotransposons (LTR Retro) are shown in black and the location of the low‐recombining pericentromeric region (Baker et al., 2014) is in gray.