
Figure 2.
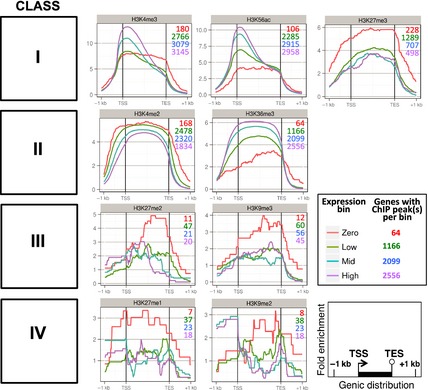
Histone modification profiles across barley genes.
Mean fold‐change enrichments in chromatin immunoprecipitation next‐generation sequencing (ChIP‐seq) peaks for each histone modification, relative to the input DNA control, are shown. Histone modifications are ordered by chromosomal distribution class (see Figure 1). Enrichment values are averaged across all barley high‐confidence genes after binning into four expression levels (see Experimental Procedures), which are indicated by different colored lines as shown. The total numbers of genes with corresponding ChIP‐seq peaks in the four expression bins are also shown and color‐coded similarly. Gene lengths are normalized against each other, introns have been removed and regions from 1 kb upstream of the transcription start site (TSS) to 1 kb downstream of the transcription end site (TES) are included.