
Figure 3.
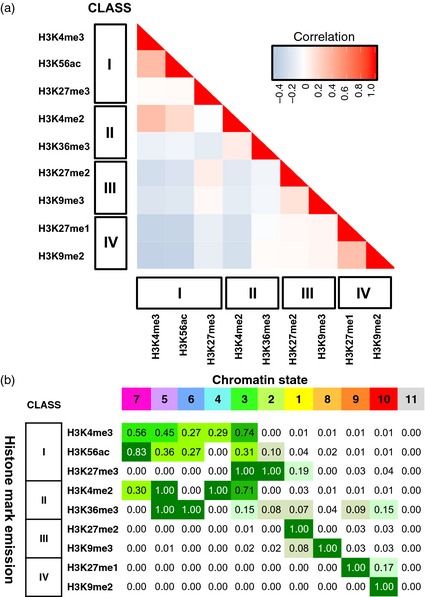
Analysis of peak sharing between modified histones and definition of chromatin states for barley.
(a) Correlation analysis of peak sharing. Modified histones are ordered in both x and y axes by chromosome distribution class (Figure 1). The peak sharing level is colour coded as indicated in the key.
(b) State emissions for an 11‐state model of the barley epigenome derived from peak sharing among the nine histone modifications in this study. States (top row) are ordered from left to right and color‐coded correspondingly (magenta to red) by decreasing involvement of their component histone modifications with the active genic environment (see Figure 2). Histone modifications (left column) are ordered by genomic distribution class (Figure 1). Each state emission (cell value) represents the probability of involvement of a chromatin mark in the corresponding state. State 11 is a zero state (no associated histone peaks).