
Figure 4.
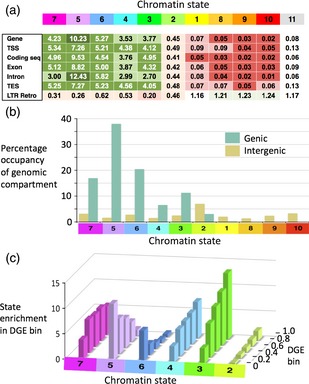
Biological properties of barley chromatin states.
(a) Enrichments of chromatin states in gene features and long terminal repeat (LTR) retrotransposons. Fold enrichments for barley chromatin states in annotated genomic features are indicated (see Results). Cell values are color‐coded from dark green (highly enriched) through white (no enrichment) to dark red (strong negative enrichment). TSS, transcription start site; CDS, protein‐coding sequence; TES, transcription end site; LTR Retro, LTR retrotransposon.
(b) Genic and intergenic occupancies of chromatin states. Total percentage occupancies for each state in total genic (green) and intergenic (khaki) spaces are shown.
(c) Relationships between chromatin state enrichment and differential gene expression (DGE). Genes are binned by five DGE levels from low (<0.2) to high (>0.8) differential expression in seedling root versus seeding shoot. Fold enrichments (see Results) for the six gene‐associated states in each DGE bin (see panels a and b) are shown.