
Figure 6.
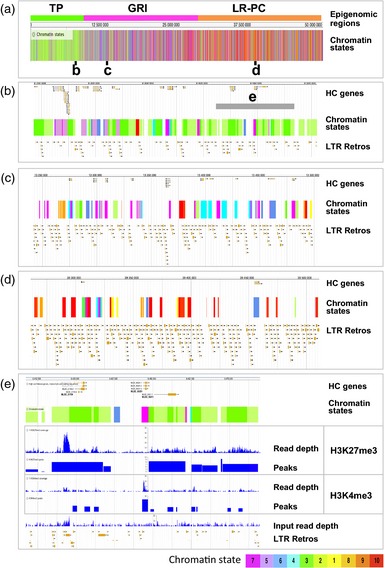
Fine structure of epigenomic features for barley chromosome 2H.
(a) Locations of selected sub‐regions from the (b) telomere‐proximal (TP), (c) gene‐rich interior (GRI) and (d) low‐recombining pericentromeric (LR‐PC) regions of barley chromosome 2H are indicated on the chromatin state plot. Chromatin states are color‐coded as in Figures 3, 4, 5 (see key at bottom).
(b) A 250‐kbp sub‐region of the TP region. The HC genes, chromatin states and annotated long terminal repeat (LTR) retrotransposons are also shown. The gray bar indicates a 75‐kbp genomic segment shown in greater detail in panel (e).
(c) A 250‐kbp sub‐region of the GRI region.
(d) A 250‐kbp sub‐region of the LR‐PC region.
(e) Fine structure of the 75‐kb genomic segment from the TP region (see panel b). The chromatin immunoprecipitation next‐generation sequencing (ChIP‐seq) read depths and called peaks for H3K27me3 and H3K4me3 are shown, together with read depth for input DNA (negative control), HC genes, chromatin states and annotated LTR retrotransposons.