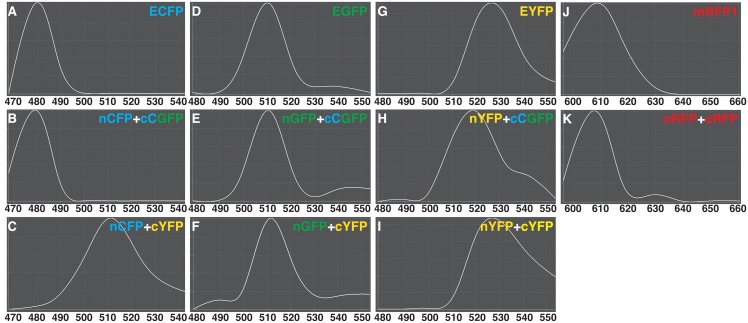
Fig 4. Fluorescence emission spectra of intact and reconstituted fluorescent proteins.
Using the interaction between PEX7 and PTS2 as one of the split combinations transiently expressed in onion epidermal cells, florescence emission spectra were measured following excitation with an argon laser at 458 nm (A–L) or a HeNe laser at 543 nm (J, K) using the LSM510 META system. X- and Y-axes represent wavelength and relative fluorescence intensity, respectively. The maximum emission of each spectrum was taken as 1.0, and in each curve, fluorescence at a given wavelength was normalized relative to the maximum. (A) non-split ECFP, (B) nCFP with cCGFP, (C) nCFP with cYFP, (D) non-split EGFP, (E) nGFP with cCGFP, (F) nGFP with cYFP, (G) non-split EYFP, (H) nYFP with cCGFP, (I) nYFP with cYFP, (J) non-split mRFP1 and (K) nRFP with cRFP.

