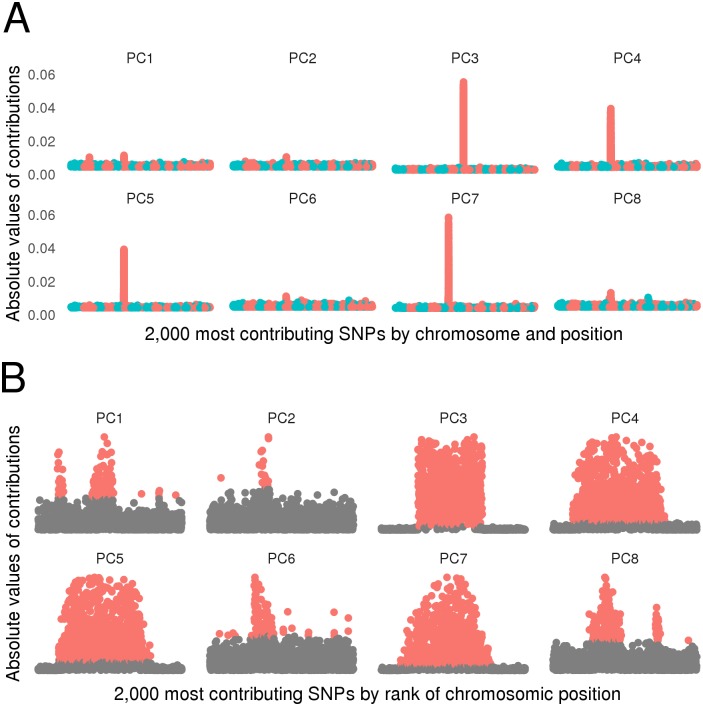
Fig 2. Selection of strong SNP contributors.
(a) The 2,000 most contributing SNPs to each of the first 8 principal components are displayed by chromosomal position and colored by chromosomes. Principal components were driven by large localized SNP groups and the chromosome 6 locus HLA was the strongest and largest contributor in all of the first 8 principal components, except principal component 5. (b) Selection of SNPs by the Gaussian mixtures based method. Selected SNPs are colored in red. SNPs are displayed on the x-axis by rank of chromosomic position, i.e. SNPs are regularly spaced and ordered by chromosome and position.

